
Detached homes · At a glance
Charleswood: the starting evidence
- Median assessed value
- $800,5002026 City assessment roll · 1,294 matched records
- Median recorded lot area
- 542 m²Middle half: 513–577 m²
Assessments use a July 1, 2025 valuation date; they are not sold prices. See the source and calculation method.
The detached assessment picture in Charleswood
Charleswood’s matching records have a mean 2026 assessed value of $884,838, with recorded values from $561,500 to $2,480,000. These are assessment-roll figures, not completed-sale prices or available listings. A mean can be affected by a few unusual properties; the range does not describe the price range of homes currently for sale.
The extract contains 1,294 matched assessment records, rather than a sales sample or an independently deduplicated house count. The directory orders groups with at least 25 records by mean assessed value. That threshold is a coverage flag, not a statistical guarantee or a sold-price ranking.
Lot and construction records: investigate the Charleswood property
Mean recorded land area in this detached group is 561 m². Recorded construction years span 1958–2025. These community aggregates do not establish the dimensions, build date, condition or usable outdoor space of the home you are considering. Obtain the actual property records and measurements.
The year span for Charleswood includes different construction periods. Compare original construction with documented additions and renovations, and investigate roof, structure and mechanical condition for the specific detached house. A recorded construction year does not show whether a home has been maintained or updated.
Confirm Charleswood’s boundary and everyday routes
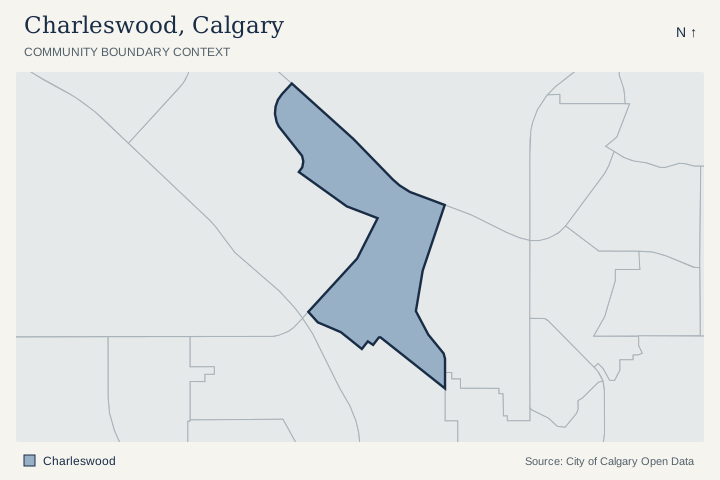
The map uses the City’s Charleswood community outline and Northwest sector label. Select the candidate address in the official property and development tools to investigate land use and nearby applications. Confirm the route to the places you actually use; a community outline does not establish walking distance or travel time.
A matching City community profile is linked below for Charleswood. It provides 2021 Census background across the community, including other housing types. It is separate from the detached-only 2026 assessment extract and should not be read as a current detached-market report.
Construction periods, neighbouring communities and park records
A closer look at Charleswood’s detached stock and setting
Choose the evidence the house needs
The largest recorded construction group is 1960–1989: 1,059 of 1,293 valid-year records (81.9%). Start with this era when organizing your questions, then check the individual property’s records.
Check which original systems and layout remain, which changes have supporting permits and records, and whether the renovation addressed structure and mechanical work as well as finishes. Original construction year does not date the latest improvement.
The mean assessment is 10.5% above the median. The middle half of recorded assessments runs from $739,625 to $921,375. This describes an unadjusted housing-stock distribution; it does not assign a location premium or value a candidate home. Recorded lots have a 541.7 m² median. Check usable dimensions, grading, easements and parking against the candidate property’s survey and documents.
Community edges to investigate
The City polygons share a boundary segment with Banff Trail, Brentwood, Collingwood, Nose Hill Park. Use the map to investigate a home near these edges; a shared polygon boundary does not establish a street connection, route or comparable-home relationship.
Named City park-site records
5 active named park-site polygons overlap the Charleswood outline by at least 100 m². The names below are City dataset labels, which can include school grounds and shared facilities.
Review the named site records
- BANFF TRAIL ELEM · neighbourhood park · City site CHW404
- CHATHAM PLACE PARK · subneighbourhood park · City site CHW383
- LAURIE PARK · community park · City site CHW428
- SENATOR PATRICK BURNS JR HIGH; CHICOUTIMI FIELD · community park · City site CHW376
- WEST CONFEDERATION PARK; FORMERLY CANMORE PARK · regional park · City site CHW402
A polygon overlap is location evidence. It does not establish a public entrance, opening hours, admission, school designation or access rights. Check the site and its operator before planning an outing. City park visitor information.
Location join checked October 8, 2026. City Parks Sites and City community boundaries. Active named park sites exclude non-park and depot categories. Shared boundaries require at least 25 metres of exact boundary; this list is not exhaustive where polygons have gaps. Areas and lengths use NAD83 / UTM zone 11N. All house figures above use the separate detached-only assessment extract.
Charleswood: detached assessment context
2026 City assessment-roll extract, checked October 8, 2026. The valuation date is July 1, 2025, with property condition recorded as of December 31, 2025. These figures describe matching detached assessment records. They are not sold prices, current inventory or a valuation of your home.
| Measure | Recorded context |
|---|---|
| Matched assessment records | 1,294 |
| Median assessed value | $800,500 |
| Middle 50% of assessed values | $739,625–$921,375 |
| Mean assessed value | $884,838 |
| Recorded assessed-value range | $561,500–$2,480,000 |
| Median recorded land area | 542 m² |
| Middle 50% of recorded land areas | 513–577 m² |
| Mean recorded land area | 561 m² |
| Recorded construction-year span | 1958–2025 |
| Coverage | 25 or more matching records |
Construction periods and calculation method
| Period | Records with a known construction year |
|---|---|
| Before 1960 | 158 (12.2%) |
| 1960–1989 | 1,059 (81.9%) |
| 1990–2009 | 22 (1.7%) |
| 2010–2019 | 31 (2.4%) |
| 2020–2026 | 23 (1.8%) |
The construction breakdown uses 1,293 records with valid recorded years. Land distributions use 1,294 positive recorded areas. The median is the midpoint; the middle 50% runs from the 25th to 75th percentile, using linear interpolation. It is not a confidence interval or a listing-price range.
Filter: 2026 roll, residential class RE, land-and-improvement type LI, sub-property uses R110 and R111 (detached and detached with backyard suite), positive assessed values. Counts are matched records, not an independently deduplicated house count. Other housing classifications and vacant-land types are excluded. Assessments can reflect a property’s stage of completion; especially in developing areas, verify completion and current property records before comparing values.
City of Calgary assessment source. The mean is sensitive to unusual properties. Use relevant completed detached sales and current competing detached listings for a property-specific value review. Read the full detached assessment analysis and methodology.
Plan a local visit
Plan your Charleswood visit
Use these separate stops to investigate your own routine. Choose your transport and check current operator details before visiting.
- Open the Charleswood outline and check the candidate address against the City property map.
- Travel from the actual detached home to the destinations relevant to your routine; record the route and entrance you would use.
- Inspect the home’s usable lot, parking, room proportions and documented renovation scope.
- Compare the Charleswood property with a second detached house of similar size, condition and lot use; keep area averages separate from the home comparison.
Compare the Charleswood home, then its competition
- How does this Charleswood detached house differ from the 561 m² mean recorded lot area, and which differences matter to your intended use?
- What do actual records establish about construction, improvements, measured living area and remaining work?
- Which recent completed detached sales and current competing detached listings support the property-specific comparison?
- What do the address and chosen program establish about school designation, and which operator documents establish any claimed amenity access?
Use these questions alongside current Calgary homes for sale; confirm which listings match your area and property requirements.
For nearby development applications and address-specific planning information, use the official Calgary development research tools.
For a detached sale in Charleswood, use property-specific completed detached sales and current competing detached listings. Explain the lot, measured living area, condition and documented improvements; the community assessment mean is background only. Review the relevant detached competition.
Questions about Charleswood
Is $884,838 a typical sold price for detached houses in Charleswood?
It is the arithmetic mean assessed value of 1,294 records matching the 2026 detached filter. It is not a median sale price, a sold-price benchmark or a valuation for a particular home.
Which homes are included in the Charleswood assessment figures?
The extract uses the 2026 roll, residential assessment class RE, land-and-improvement property type LI, sub-property uses R110 and R111 (detached and detached with backyard suite) and positive assessed values. Other housing classifications and vacant-land property types are excluded. These are matched records; completion and classification still require property-specific verification.
Why compare Charleswood with these other communities?
Haskayne, Rocky Ridge, Edgemont are research alternatives in the same City sector with relatively close mean detached assessed values. This selection does not claim that they are adjacent or that individual houses are comparable. Check the actual home, location and relevant sales evidence.
Official sources and local resources
An original area-planning guide with links to the relevant City, school, association and operator resources. Local collection checked . The City profile is a 2021 Census resource. Confirm current hours, programs and access with the linked source; school designation depends on address and program.
- CommunityCity community profile (opens in a new tab)2021 Census
Official demographic and household context from the 2021 Census.
- AssessmentCity detached assessment source (opens in a new tab)2026 assessment roll · R110 / R111
Positive residential land-and-improvement records classified R110 or R111 (detached and detached with backyard suite). Assessed values are not sold prices, listings or a current valuation.
- MapCity community boundary source (opens in a new tab)Charleswood · Northwest sector
Official community outline used by the map. A boundary does not establish routes, amenities, school designation or membership.
- SchoolsCheck designated schools (opens in a new tab)Address and program
Use your home address and chosen program to confirm public school designation.