
Detached-home decisions · Calgary and Foothills
Calgary detached research pack: charts, data and citation
Download two original Calgary detached assessment charts, aggregate data for 208 communities, methodology and source-labelled citation notes for editors and newsletters.
Assessment context: 2026 roll, checked October 8, 2026. The valuation date is July 1, 2025 and the property condition date is December 31, 2025. These charts describe assessment records, rather than current sale prices or live inventory.
Download the research with its context.
The package contains two original charts in PNG and SVG, a CSV of all 208 covered community aggregates, the eight chart examples, methodology and citation notes. No email is required.
These 208 communities contain 307,041 matching detached assessment records. The eight chart examples are selected from estate, west-side and lake-community guides to illustrate variation. They are not an exhaustive list, a random sample or a ranking of all Calgary communities.
Chart 1: look inside the assessed-value range.
The dot shows the median. The line shows the middle 50% of matching assessed values, from the 25th to the 75th percentile. A broad range is a reason to inspect the mix of homes; it does not establish a sale premium, current asking-price range or statistical confidence interval.
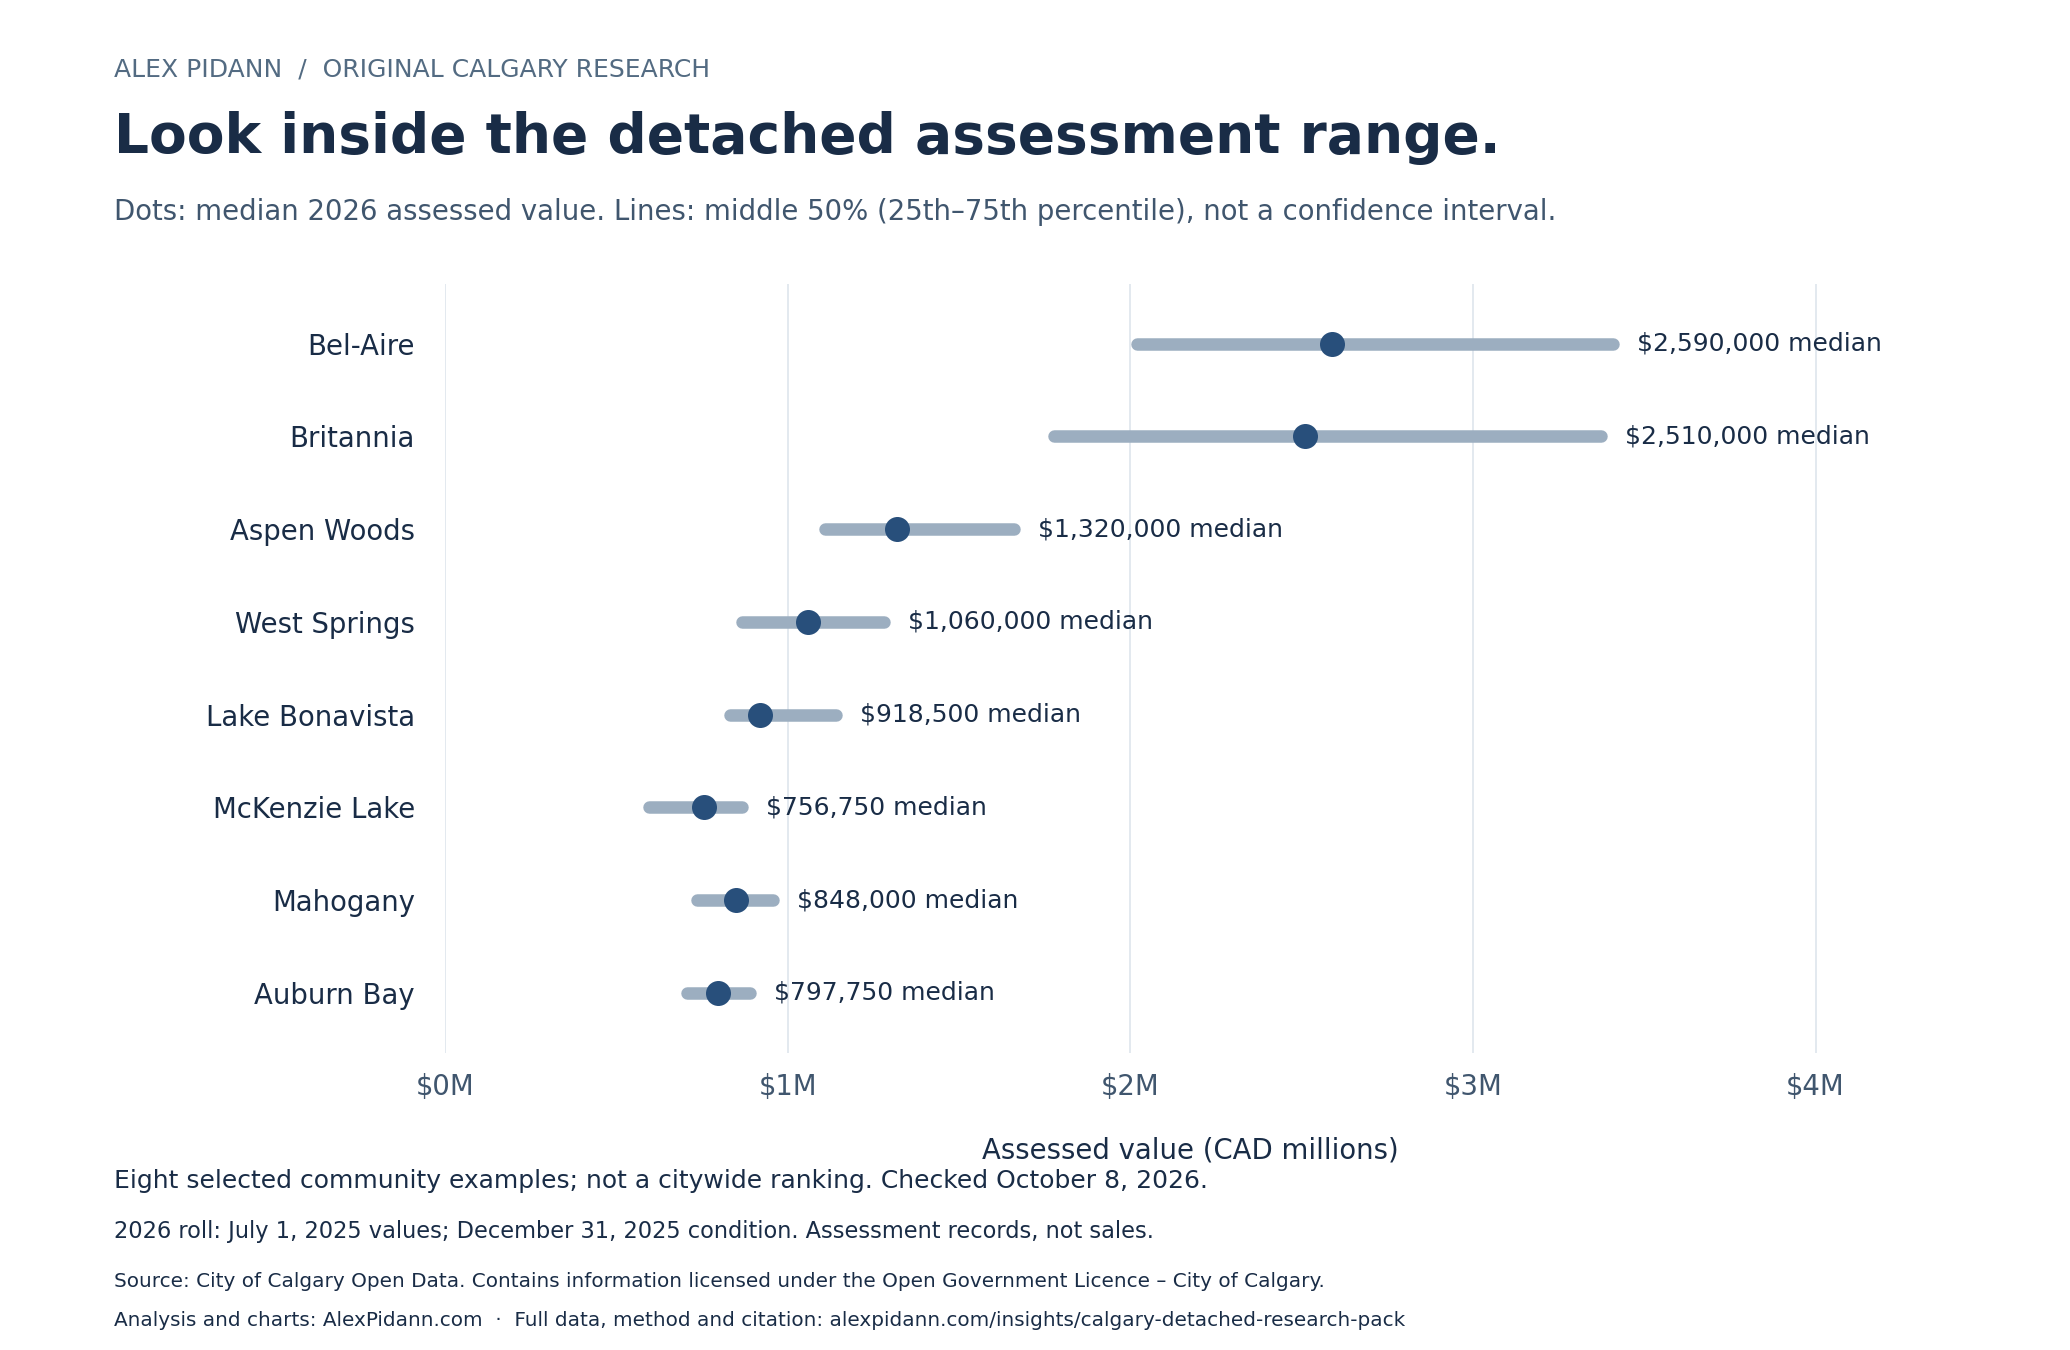
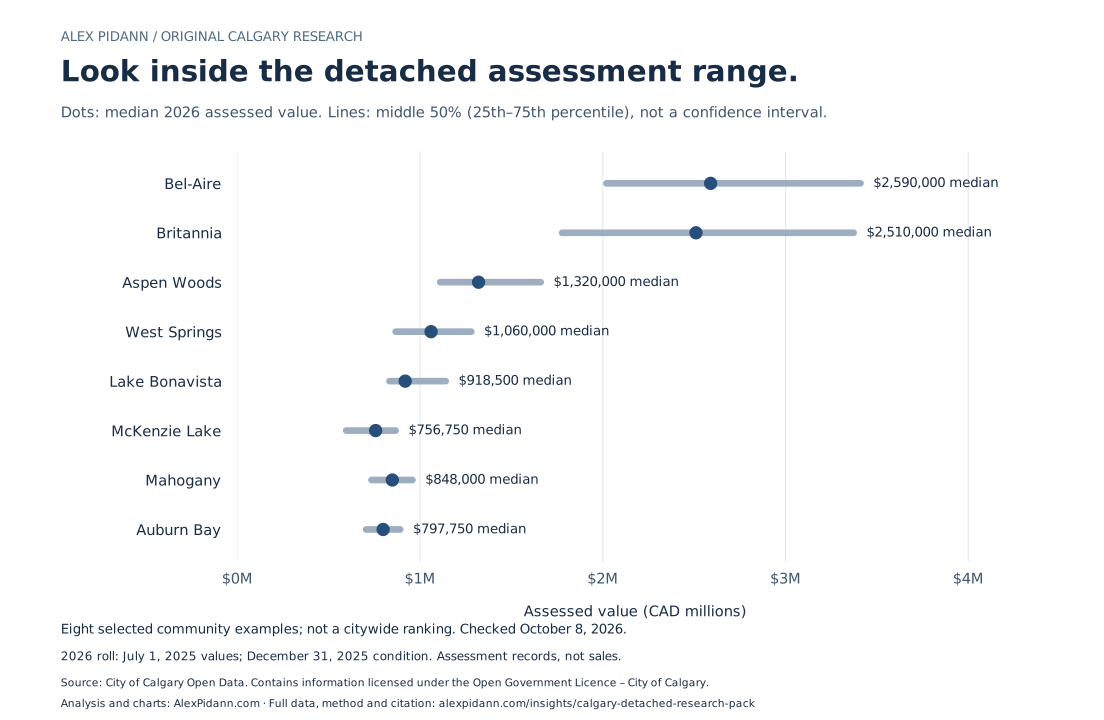
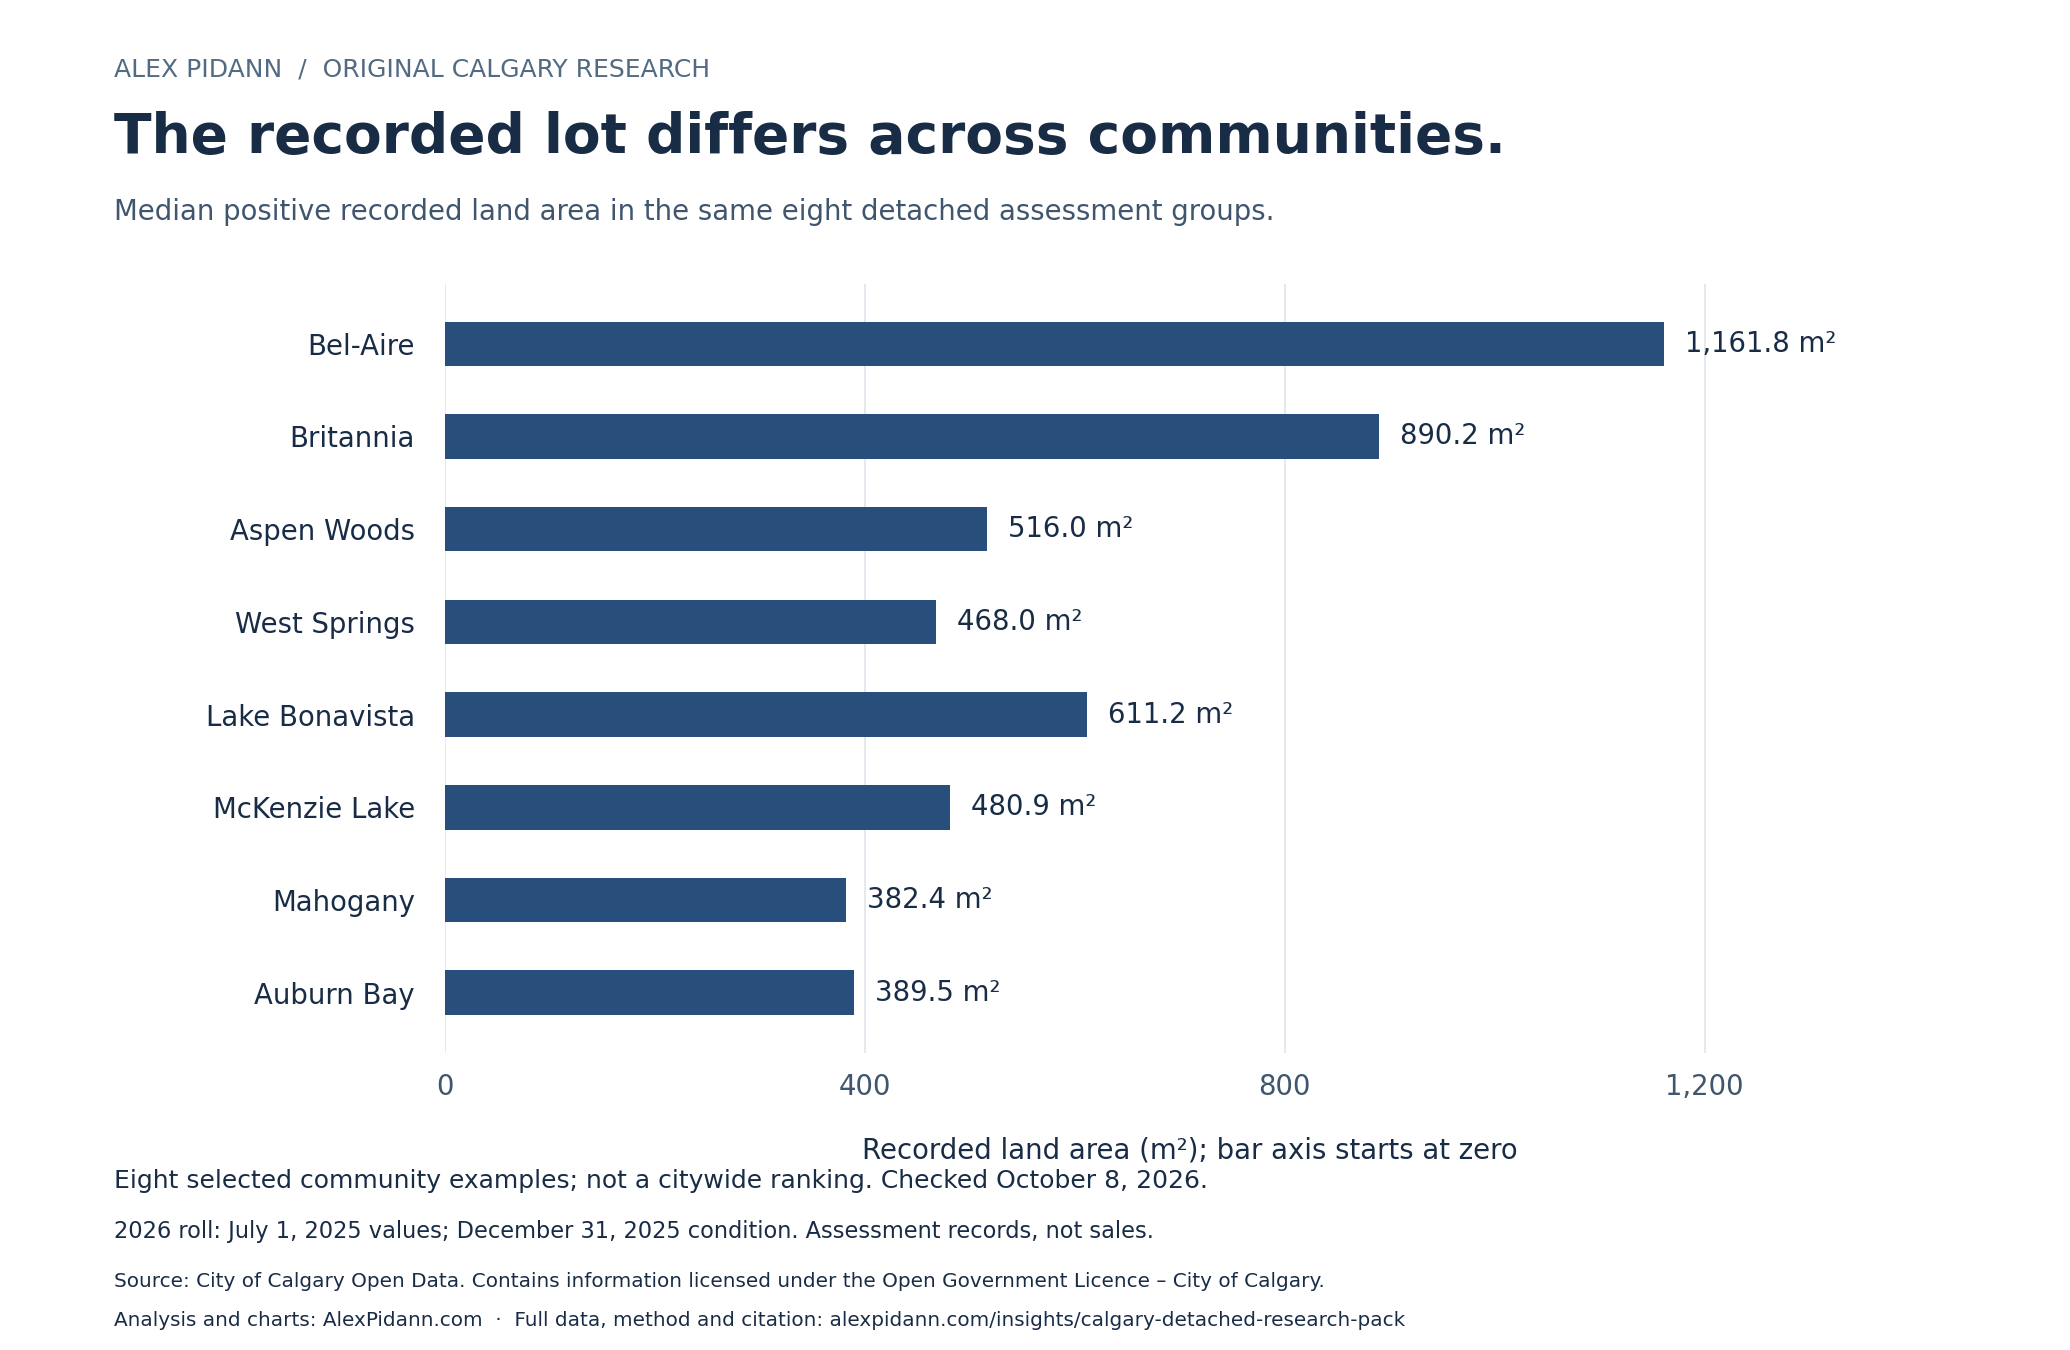
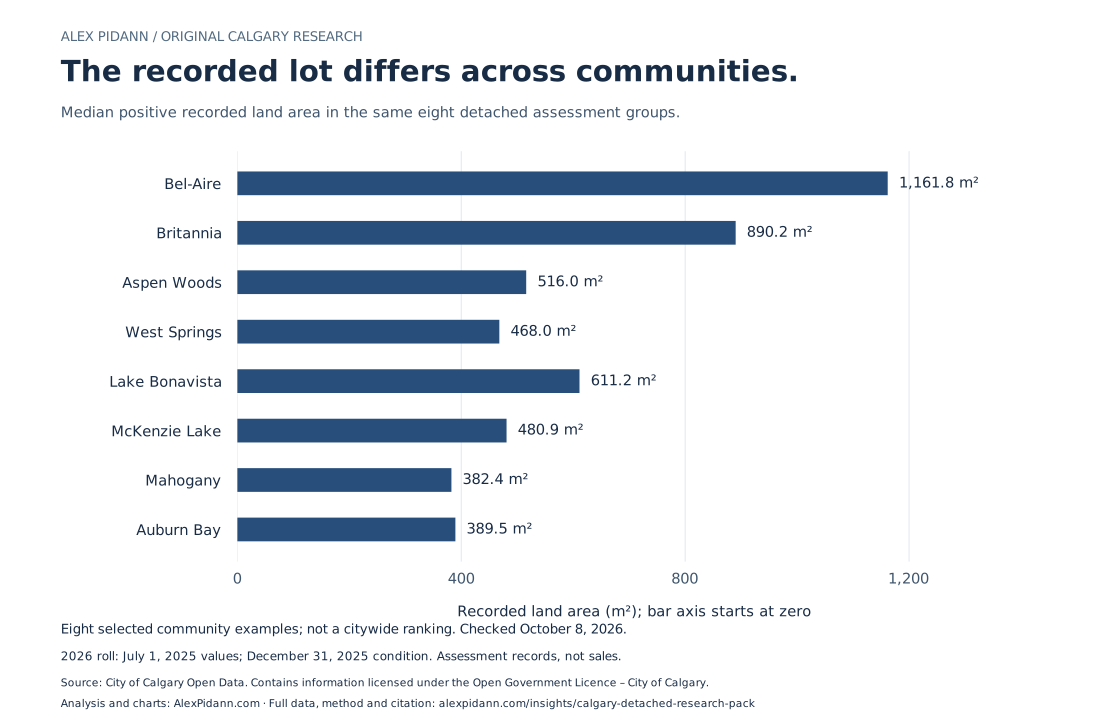
Chart 2: compare the recorded lot.
The bar shows median positive recorded land area. The axis starts at zero. Recorded land area does not establish usable yard space, title dimensions, setbacks, terrain or private amenity rights for a particular home.
The exact values behind both charts.
| Community | Matching records | Median assessed value | Middle 50% | Median recorded lot |
|---|---|---|---|---|
| Bel-Aire | 157 | $2,590,000 | $2,020,000–$3,410,000 | 1161.8 m² |
| Britannia | 256 | $2,510,000 | $1,777,500–$3,372,500 | 890.2 m² |
| Aspen Woods | 2,391 | $1,320,000 | $1,110,000–$1,660,000 | 516.0 m² |
| West Springs | 2,807 | $1,060,000 | $866,250–$1,280,000 | 468.0 m² |
| Lake Bonavista | 3,257 | $918,500 | $832,500–$1,140,000 | 611.2 m² |
| McKenzie Lake | 4,238 | $756,750 | $595,500–$866,000 | 480.9 m² |
| Mahogany | 4,493 | $848,000 | $734,000–$958,000 | 382.4 m² |
| Auburn Bay | 3,826 | $797,750 | $705,000–$891,000 | 389.5 m² |
For these eight examples, the positive-land-area record count equals the matching assessment record count. The complete CSV provides separate counts for each community. Download the eight chart examples or inspect the methodology and pooled distribution data.
Citation editors can use.
City of Calgary Open Data, 2026 detached assessment records; original aggregation and charts by Alex Pidann / AlexPidann.com, checked October 8, 2026.
Link the attribution to this research package and the original City dataset. Retain the units, selected-example scope, assessment dates and limitations when reproducing the original charts. Attribution does not imply City endorsement.
Contains information licensed under the Open Government Licence – City of Calgary. This package supplies original charts and community aggregates; it does not reproduce CREB charts, Town maps or property photographs.
Three useful editorial angles
- Why an area average can hide substantial variation in the same detached community.
- Why recorded lot size and a home’s usable outdoor space need separate investigation.
- Why dated assessments and current detached sales statistics answer different questions.
For a current sales-market comparison, use the separate Calgary, Okotoks and Heritage Pointe detached briefs. For a quotation or further explanation, contact Alex about the research.
Method and limitations
The filter uses the 2026 roll, residential assessment class RE, land-and-improvement property type LI, detached sub-property uses R110 and R111, and positive assessed values. The covered groups are the 208 named Residential communities with matching records in the City boundary metadata. Industrial and residual subareas are excluded. Counts describe matching assessment records, rather than completed sales or an independently deduplicated number of houses.
Quantiles use linear interpolation at (n−1) × p (R7). Land-area distributions use positive recorded areas. Communities with fewer than 25 matching records carry a limited-sample flag in the full CSV; it is an editorial coverage flag, not a confidence guarantee. Classification, parcel accounting and incomplete construction can affect the distributions.
The CSV contains community aggregates and no parcel addresses. The package freezes the snapshot checked October 8, 2026; the underlying City dataset can change. Read the complete source method and coverage reconciliation, or investigate the covered neighbourhood guides.